2023 · Product design · UX/UI · Hardware
e-Preve
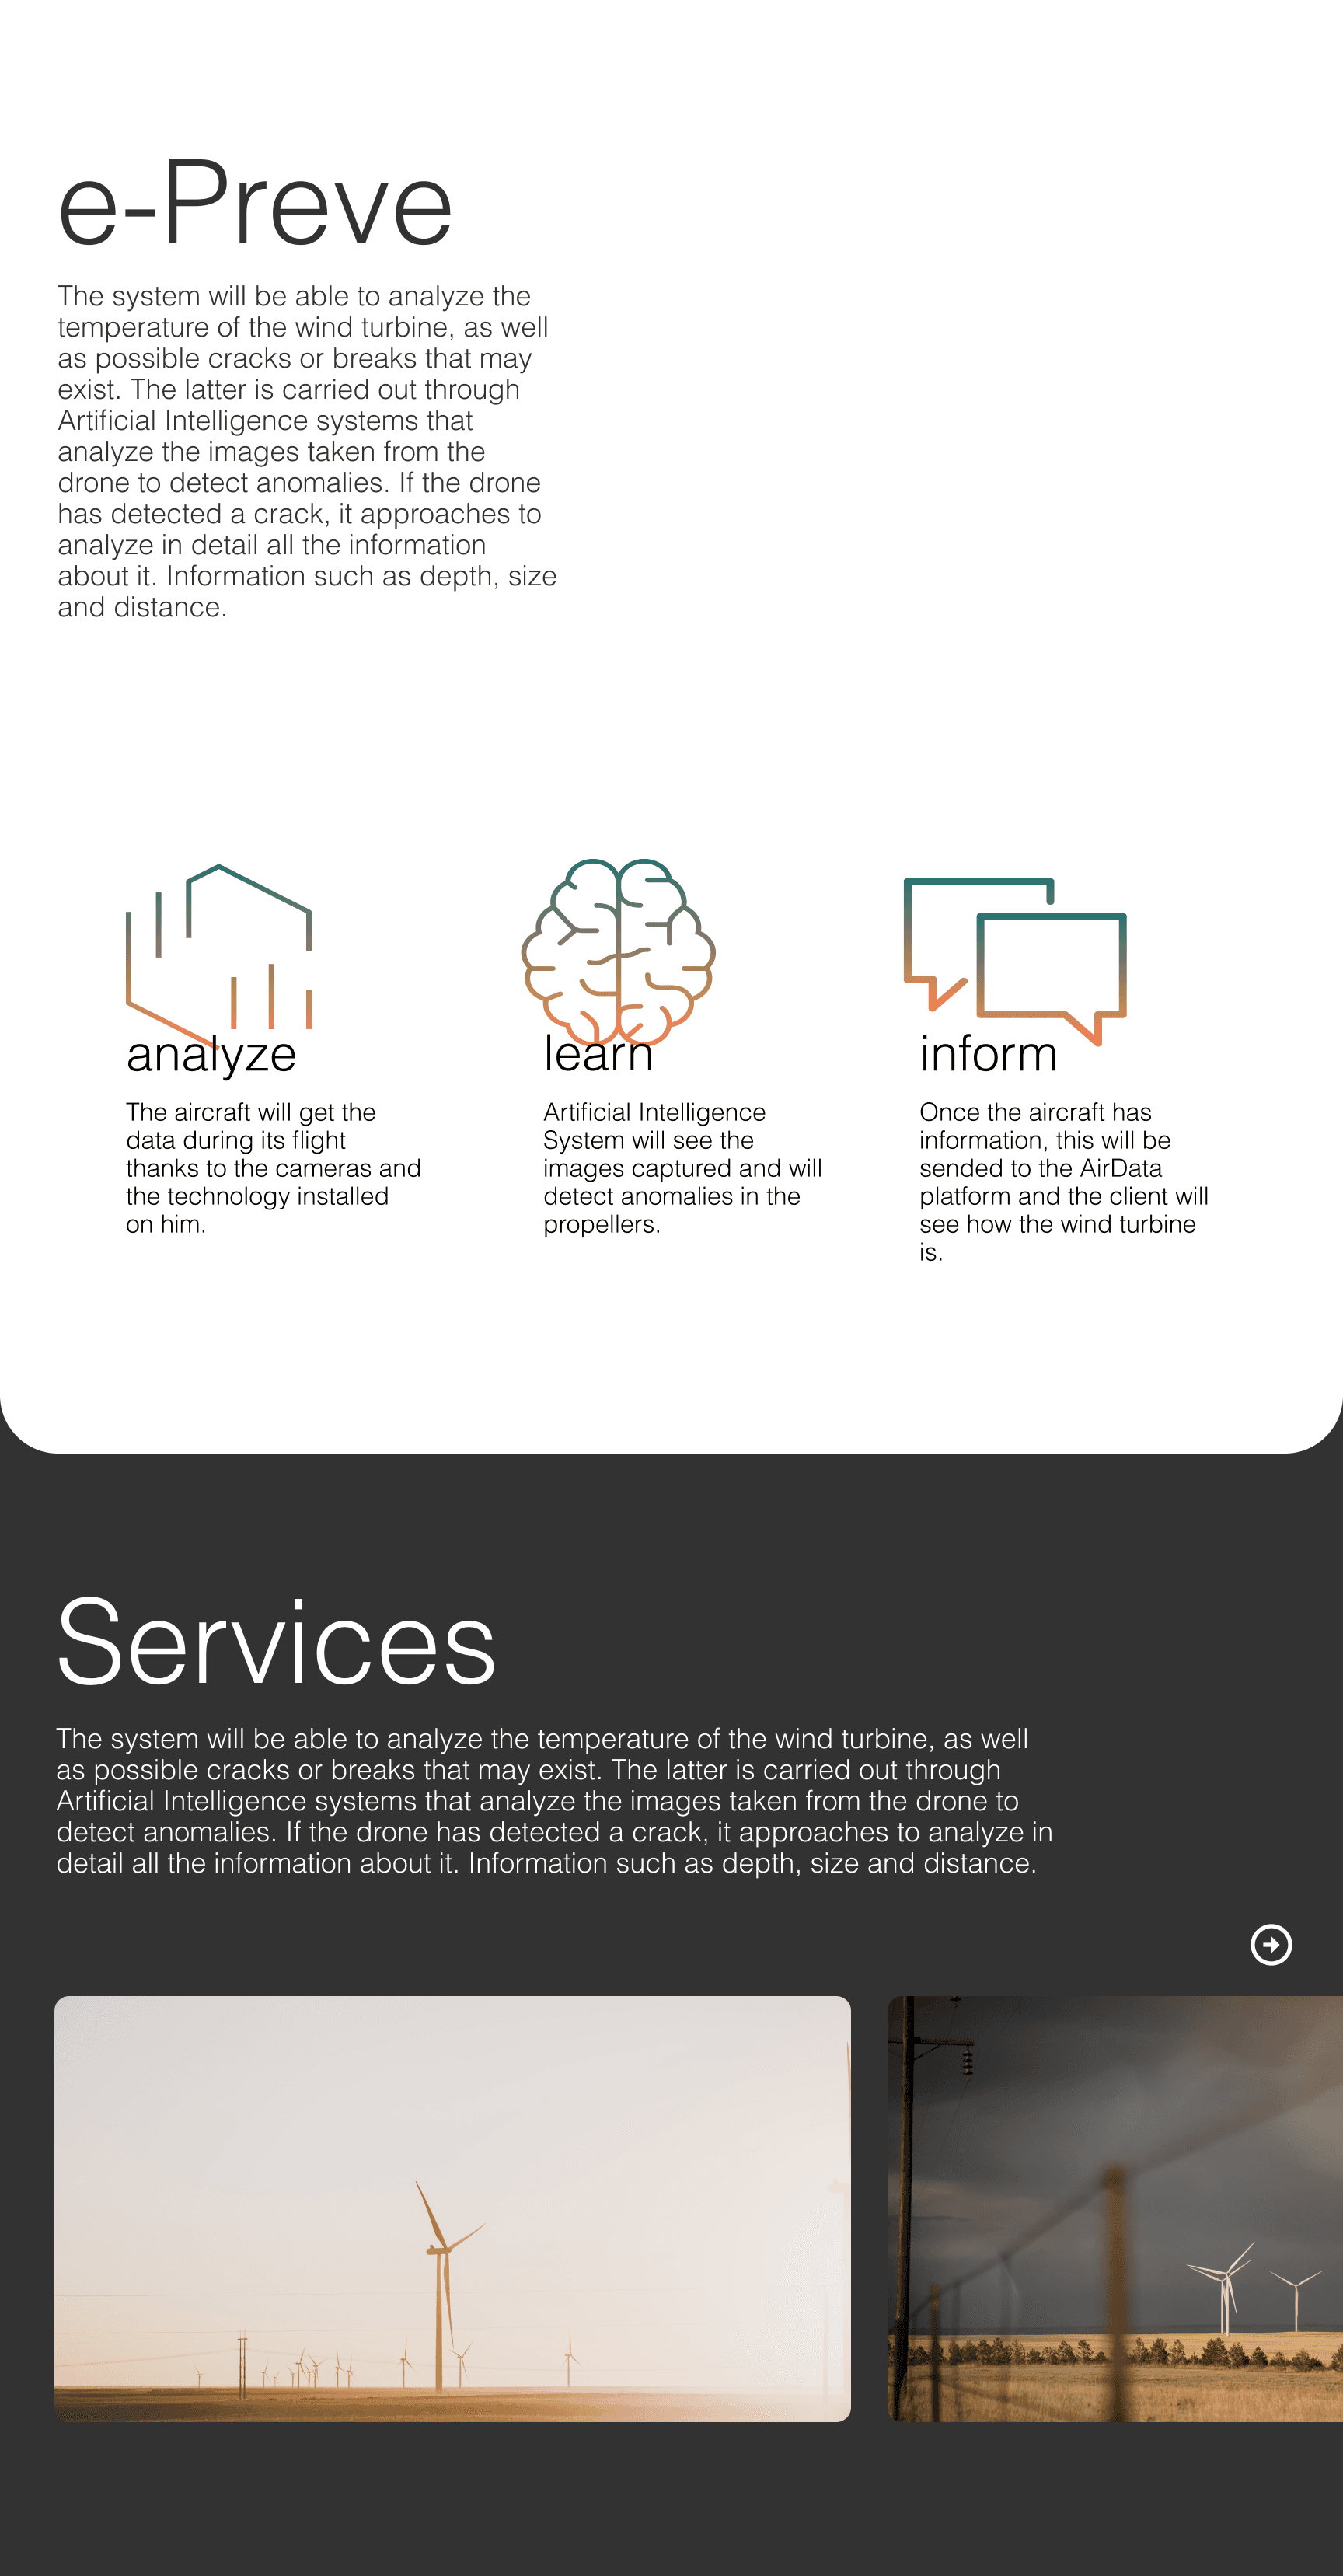
e-Preve is a project for autonomous preventive and predictive maintenance of wind turbines.
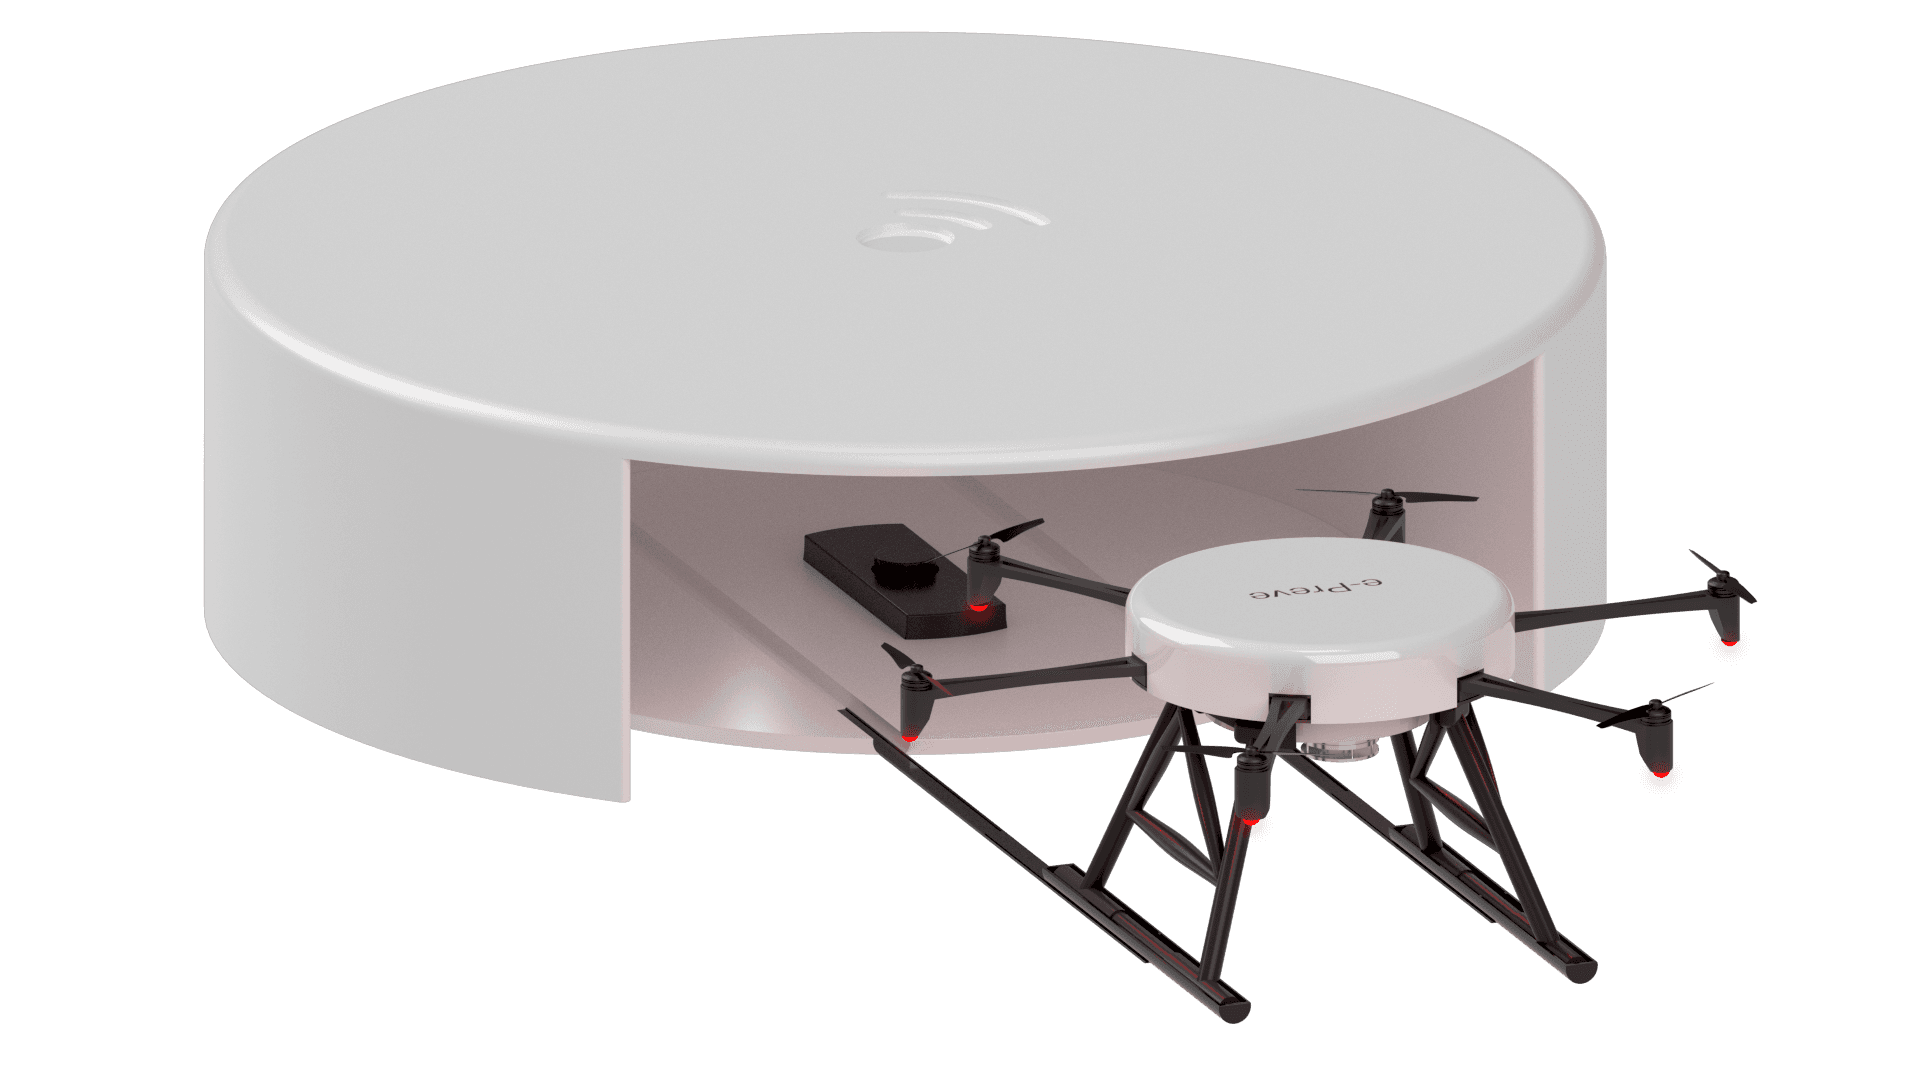
e-Preve combines hardware and software to automate technical inspections in wind farms. It's made of the drone (e-Preve N1) —a hexacopter purpose-built to fly analysis missions for 28 minutes and ride out strong wind gusts— and a dock station (e-Preve N1 Box) anchored to the turbine's nacelle, from where every inspection starts and ends. The capsule protects the drone from the weather between flights, recharges it, and releases it to the programmed waypoints when it's time to fly. On top of that sits e-Preve AirData: the software where companies design the drone's route and trigger an inspection remotely, with no need to bring technicians on site.
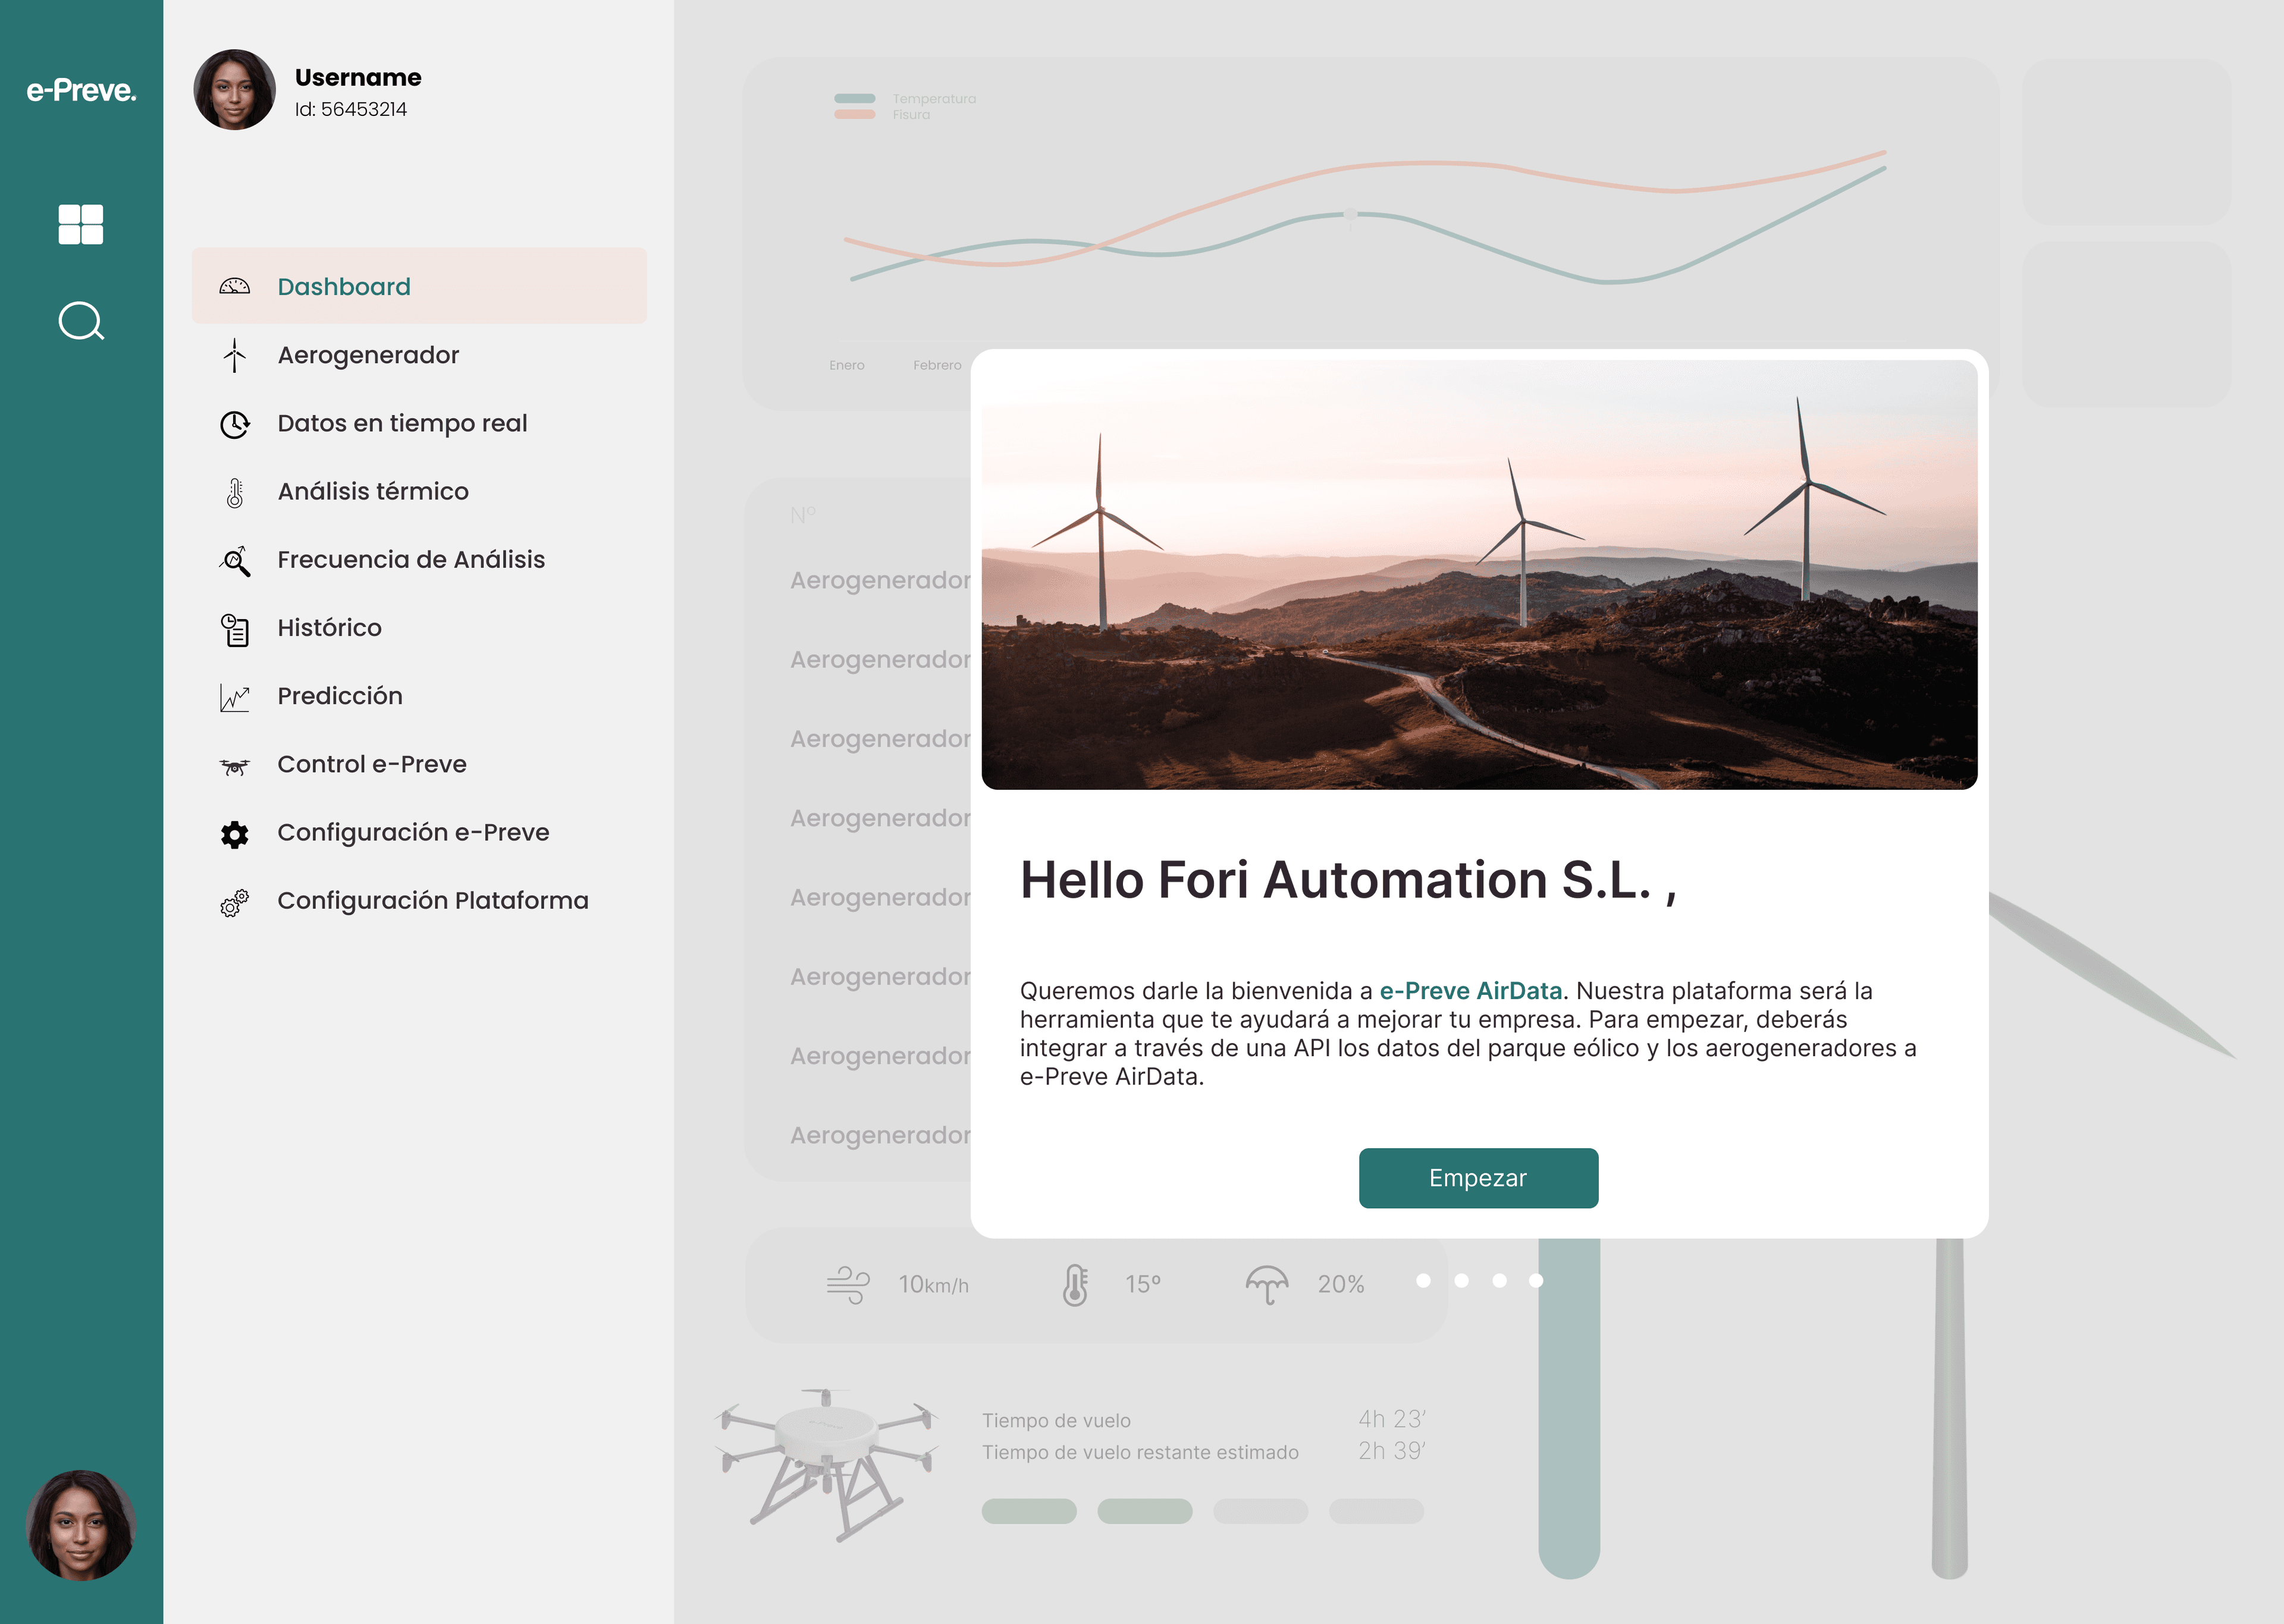
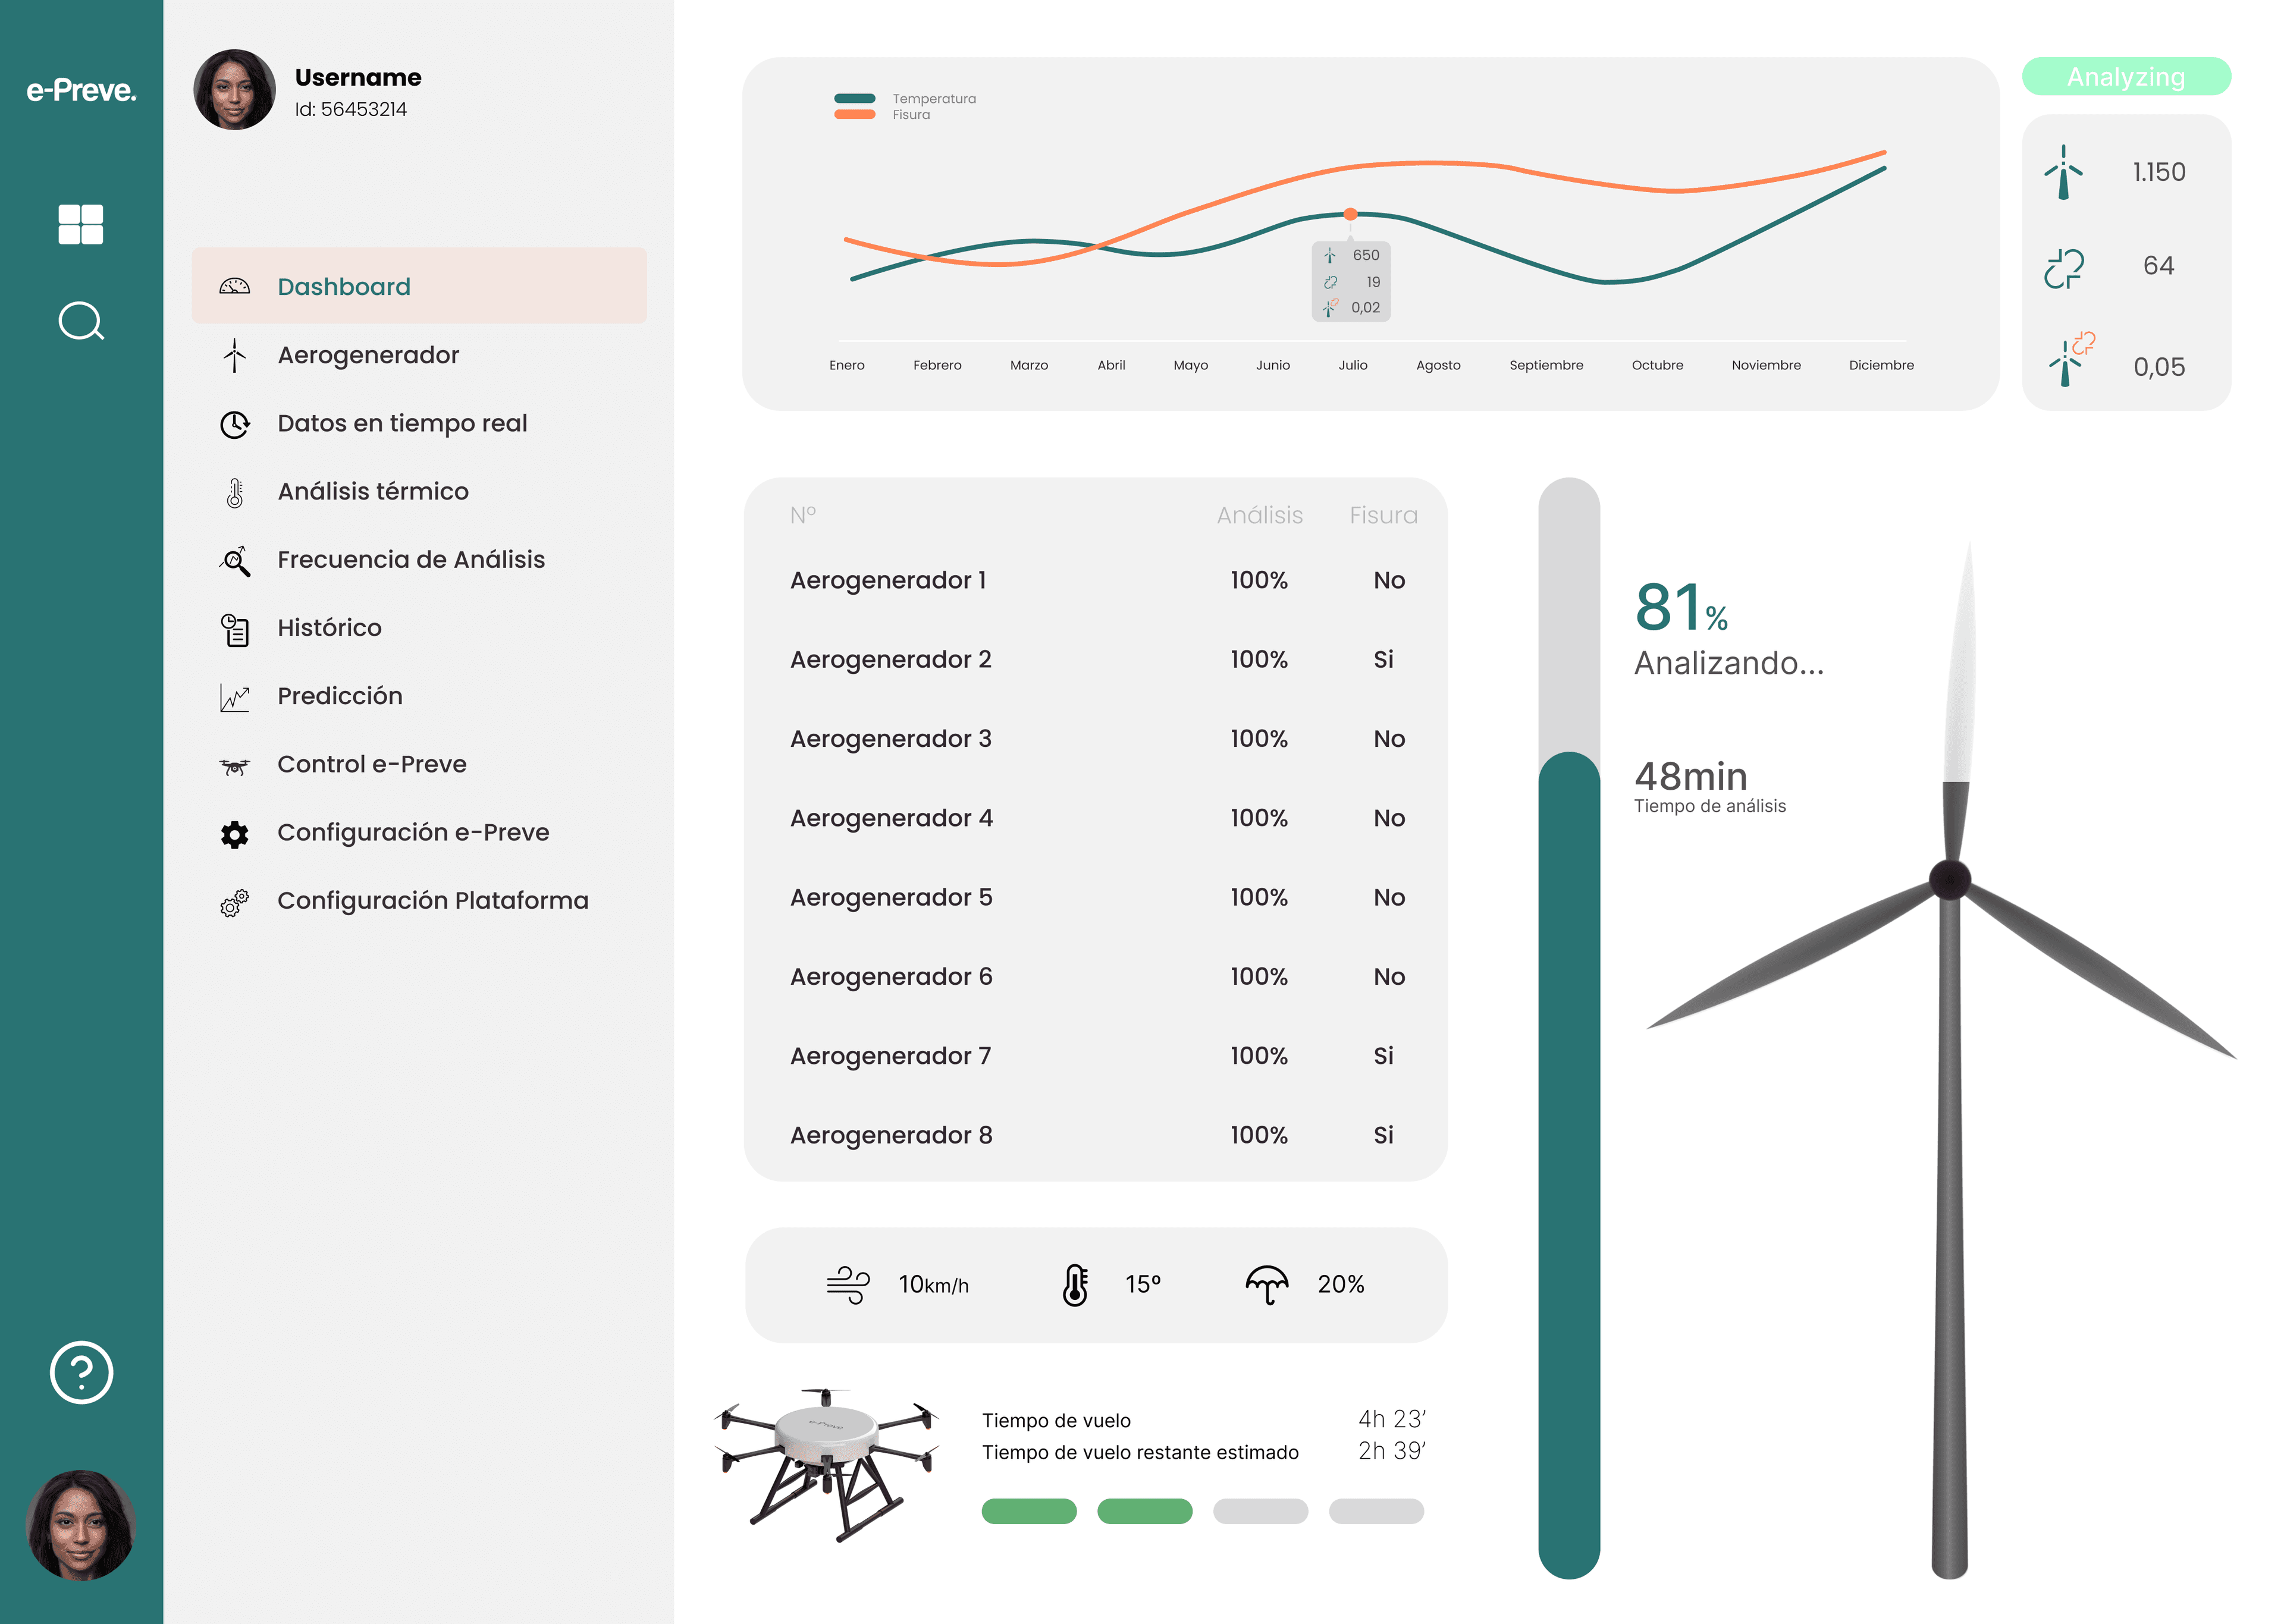
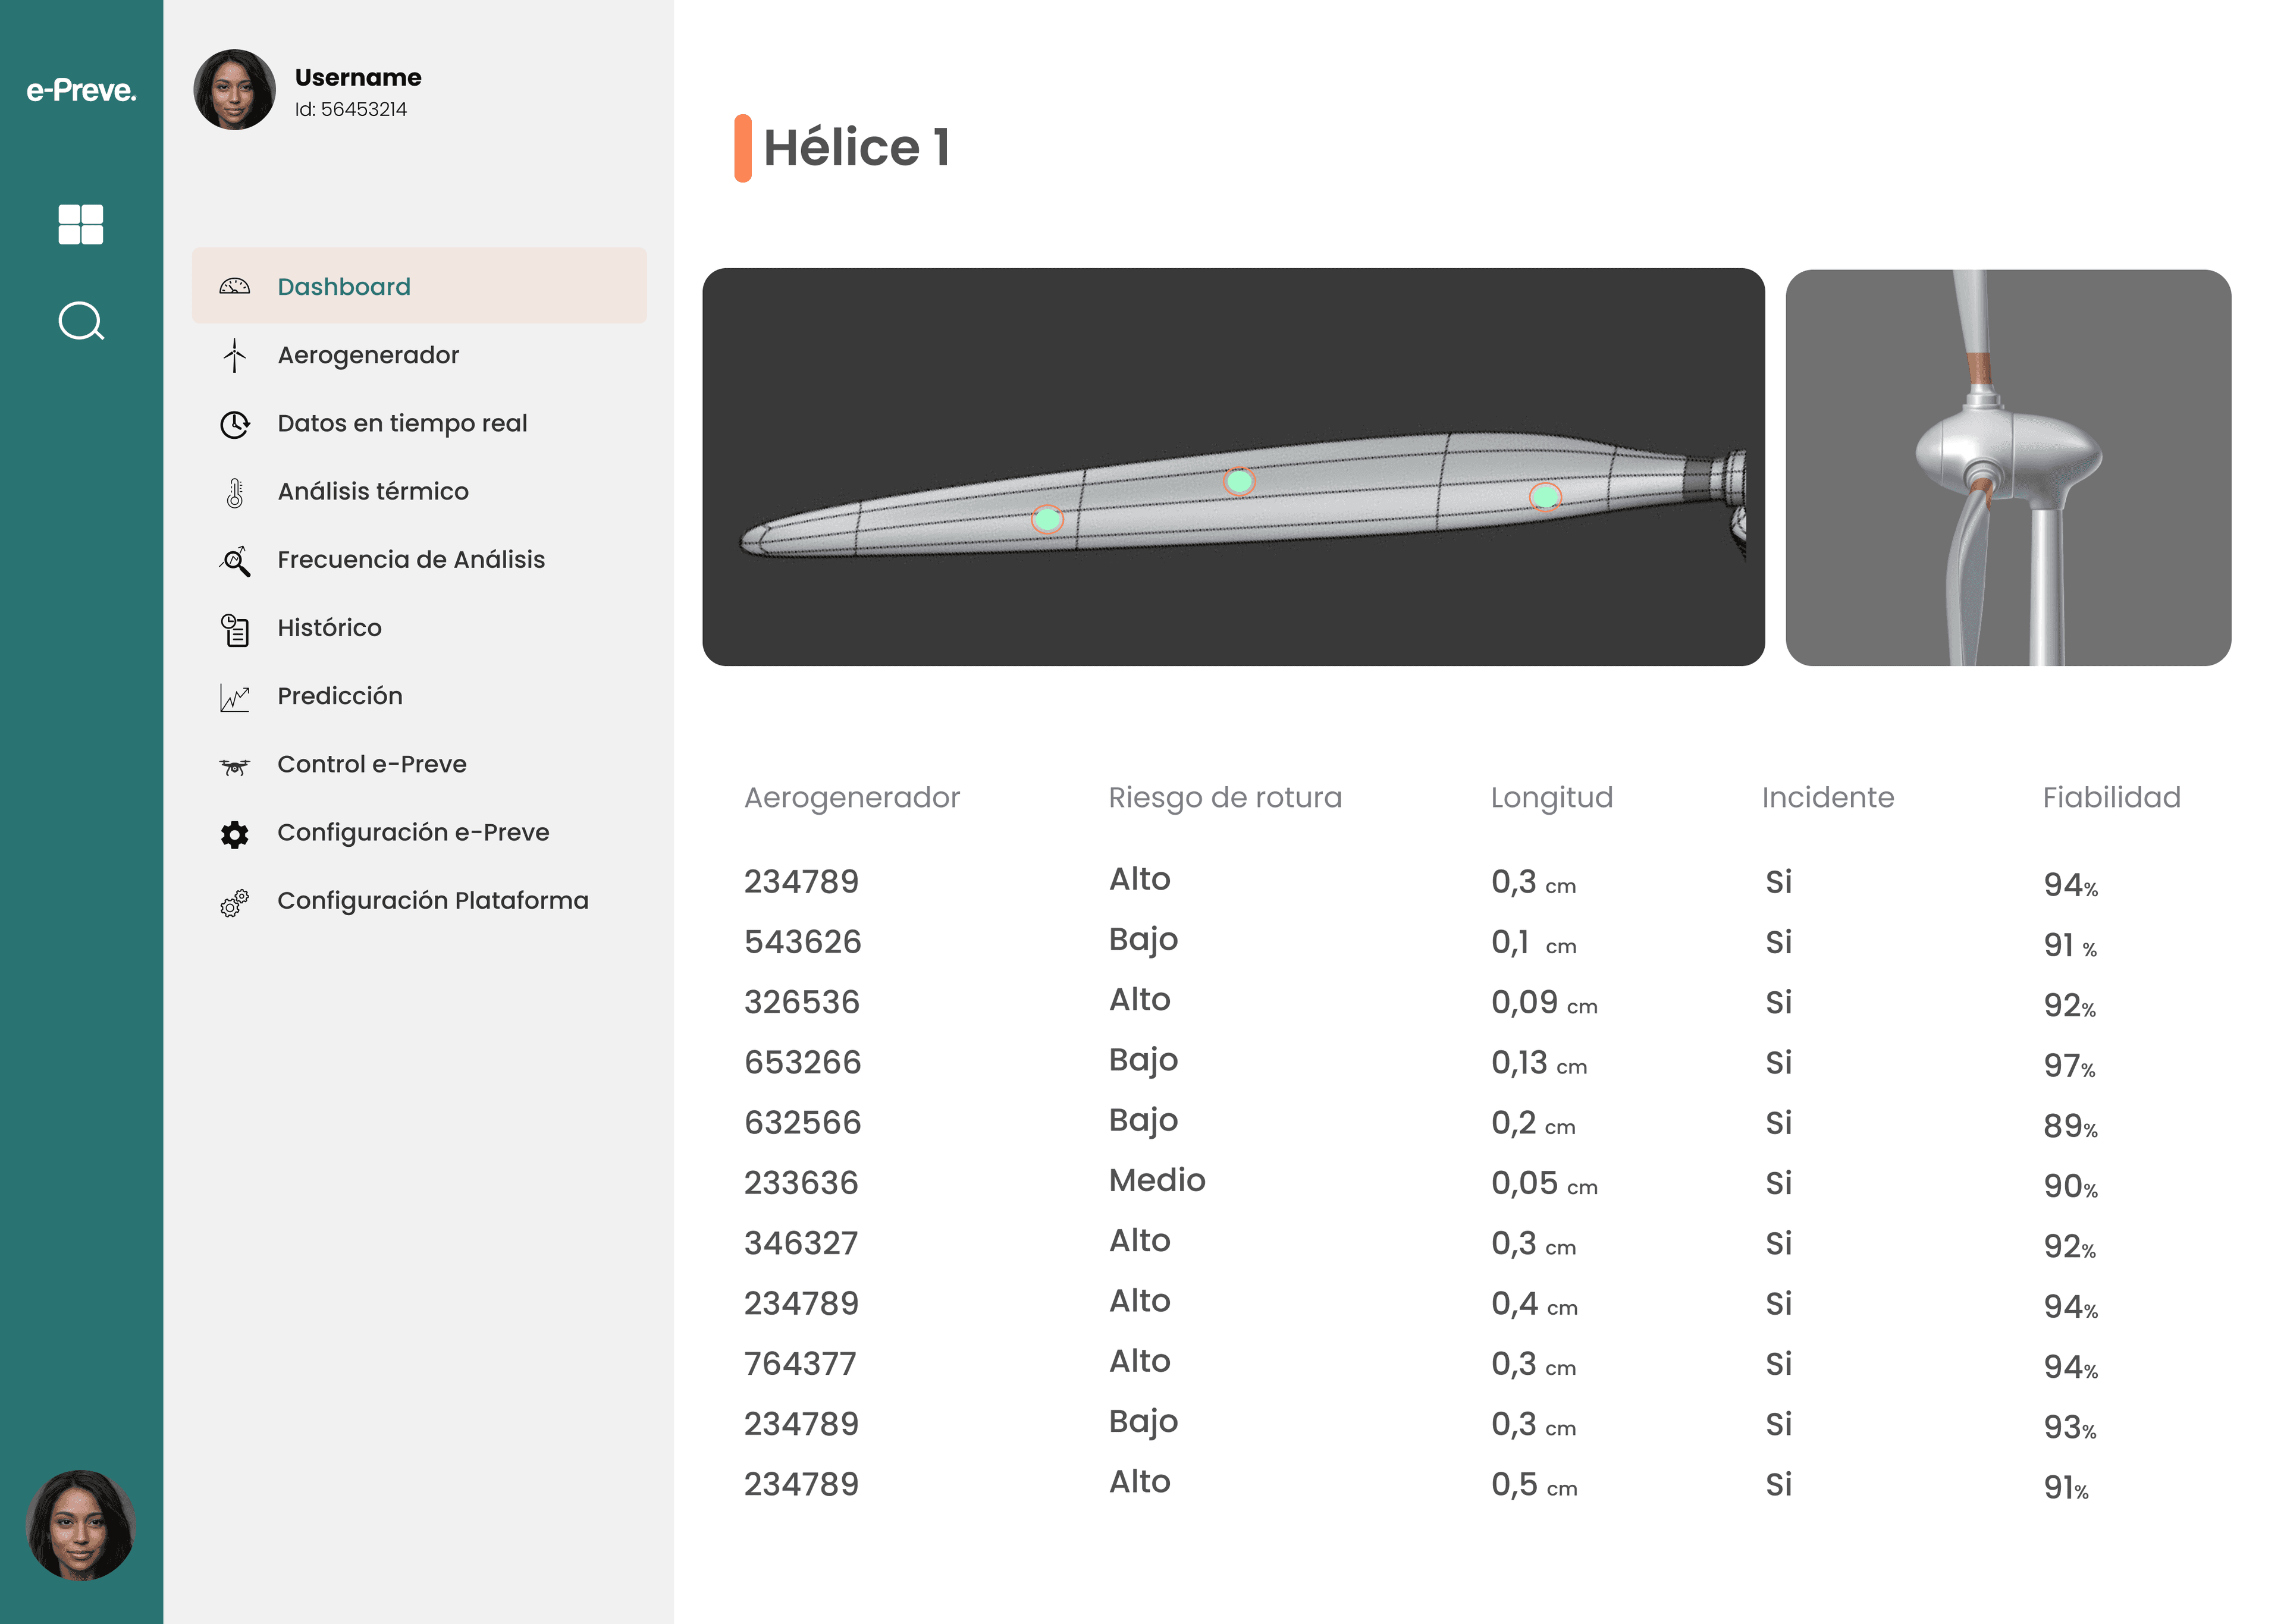
On the analysis side, the dashboards consolidate the status of each turbine, the progress of the active flight, the drone's monitored components, the cracks detected with their risk level and reliability, and the satellite route with the programmed waypoints — all aimed at cutting maintenance costs, minimising downtime and improving inspection safety by removing complex manual checks.
Planning happens on the map: the operator draws the drone's route around the turbine, marks the critical points to inspect and saves that mission to repeat it on every periodic check. No paperwork, no coordinating rope-access teams, no going back to the farm more often than strictly needed.
The next step was validating it in the field. The drone prototype was built and flown with the exact mission coming out of AirData, closing the loop end-to-end: from software to hardware and back to a report the wind-farm manager could read at their desk the next morning.
The dashboard answers «what's happening right now?». The Turbine view answers a different — and usually more urgent — question: «which machine do I service first?».
Turbine
A table that decides which turbine gets serviced today and which one can wait until Monday.
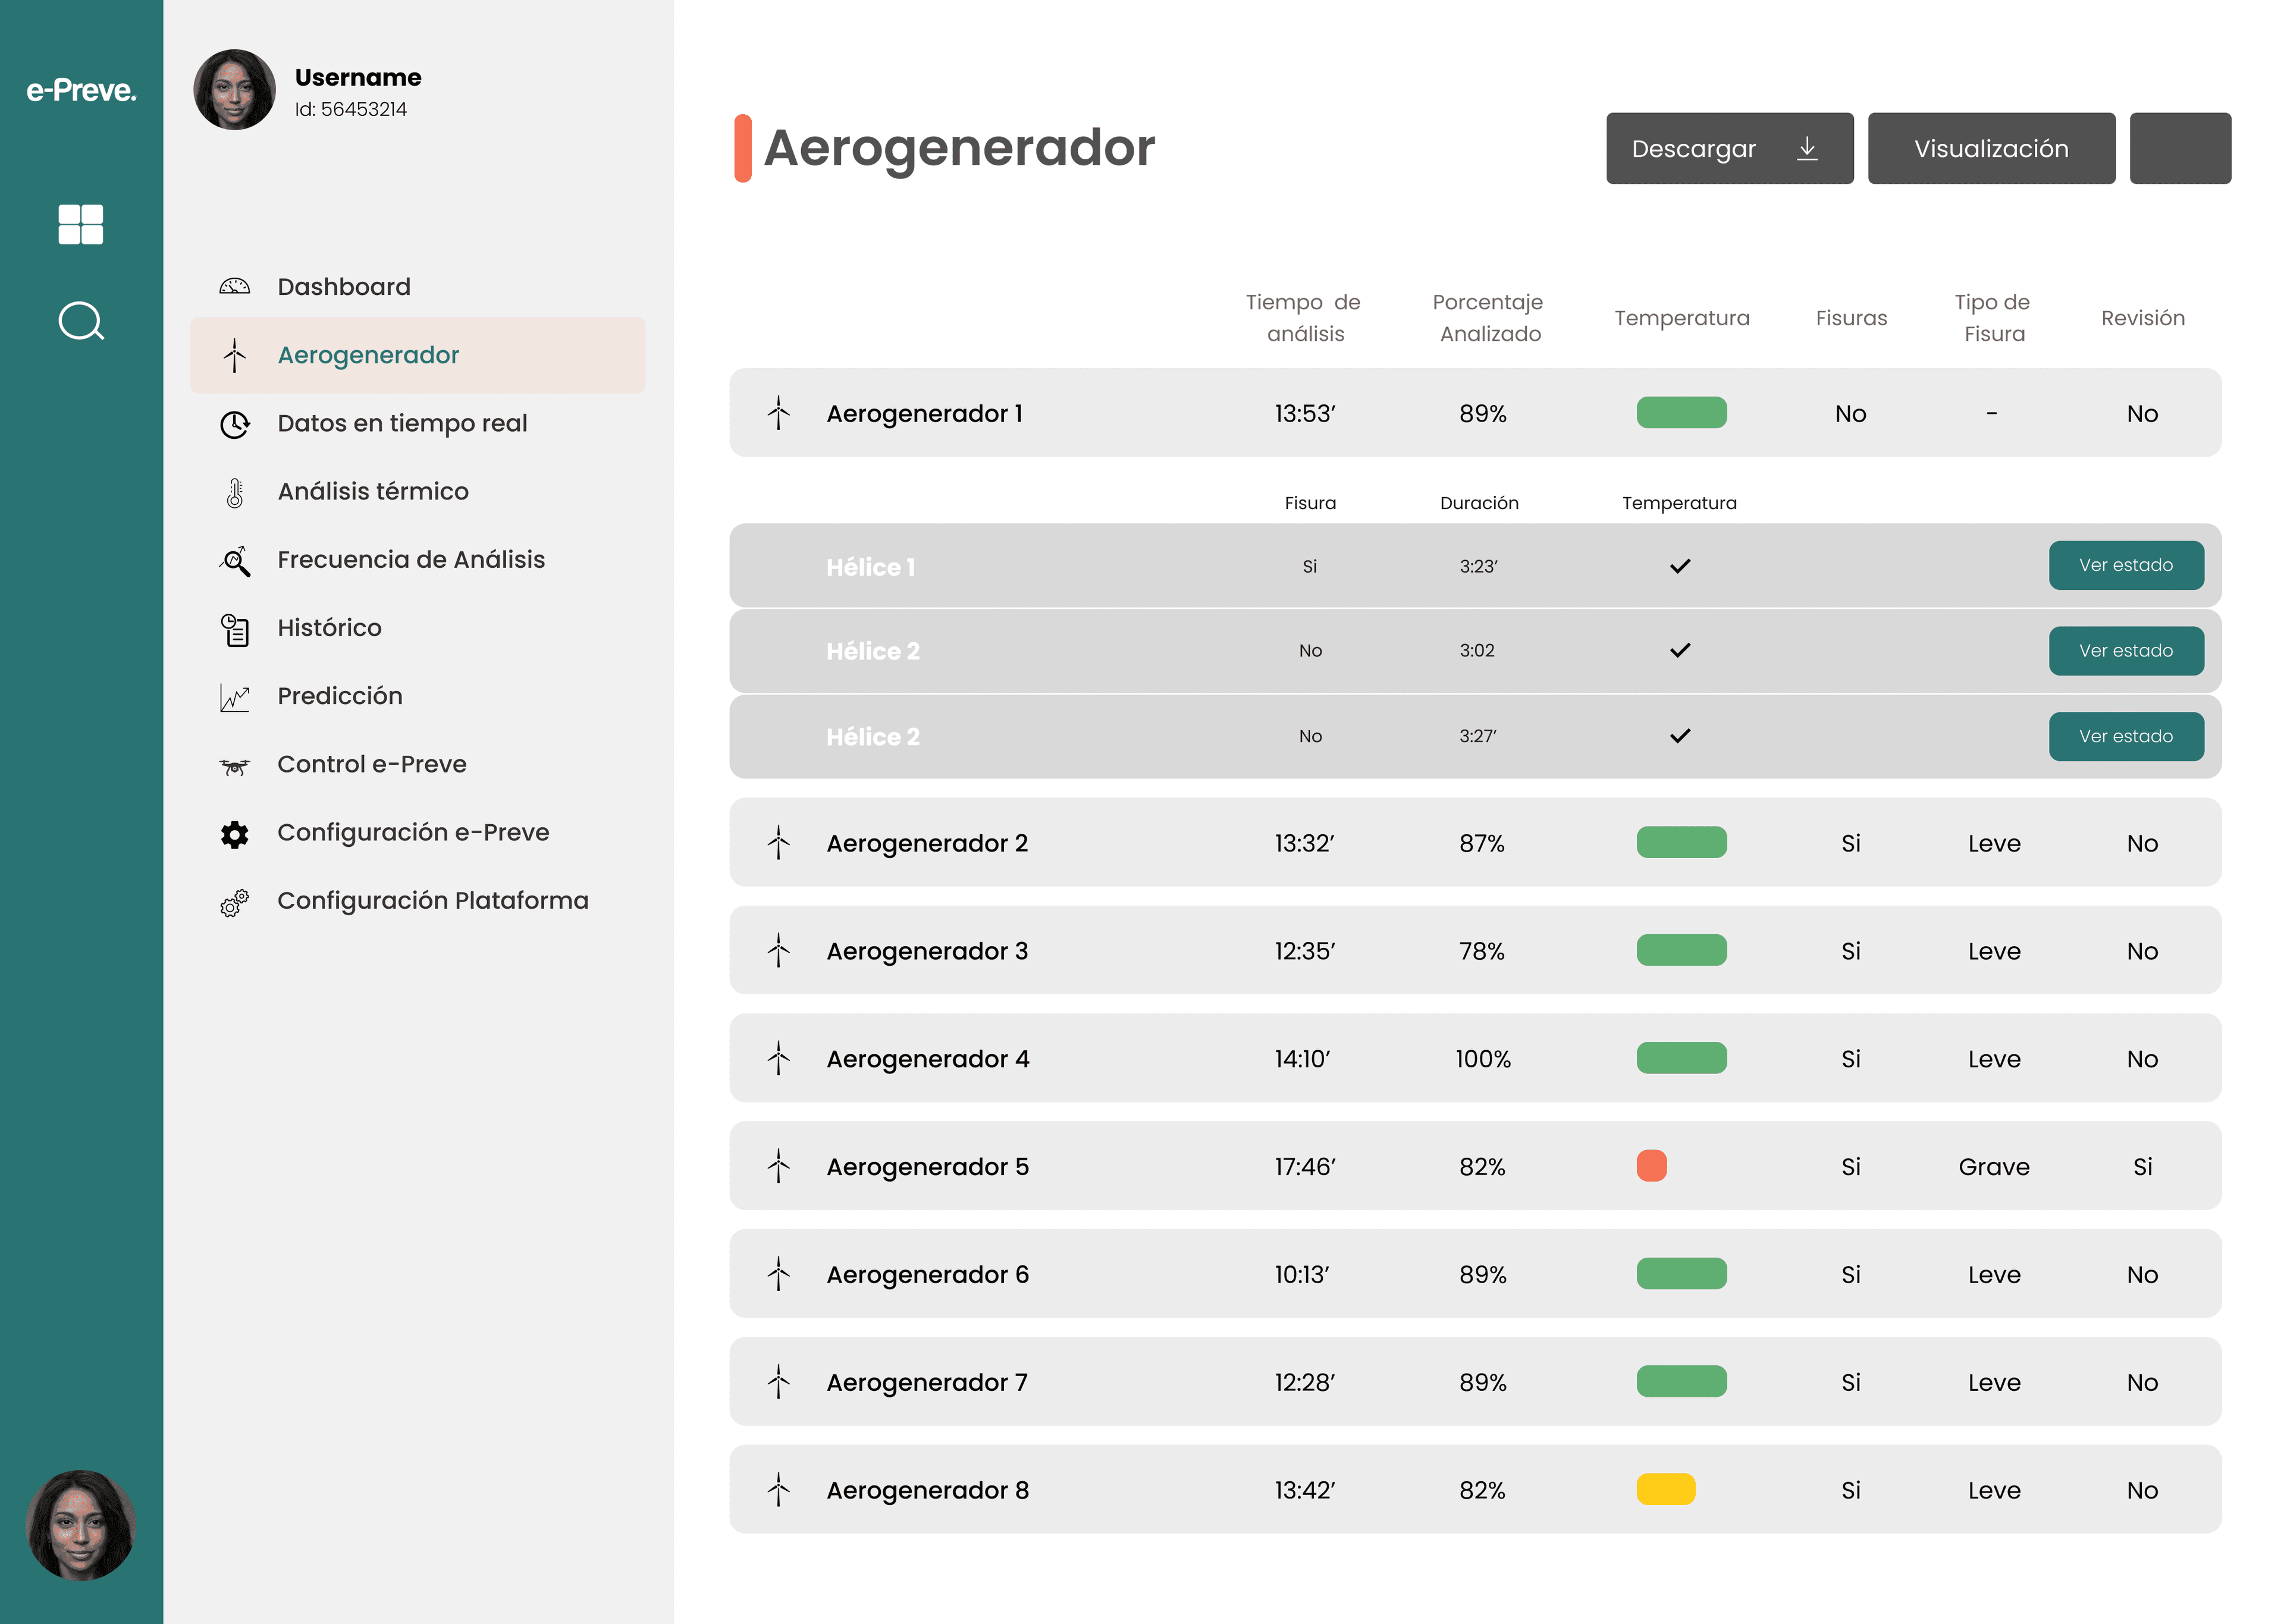
The Turbine screen is the wind-farm's executive summary. Every turbine in the list expands into its three blades with analysis time, duration, temperature, crack presence, type (mild/severe) and whether human review is required. Temperatures are encoded with coloured bars — green, yellow, red — so the technician spots the day's urgencies at a glance. Above the table, three buttons: Download, Visualisation and export — because when the inspection ends, the report has to leave the platform.